Tiger Cloud: Performance, Scale, Enterprise, Free
Self-hosted products
MST
Real-time analytics applications require more than fast inserts and analytical queries. They also need high performance when retrieving individual records, enforcing constraints, or performing upserts, something that OLAP/columnar databases lack. This pages explains how to improve performance by segmenting and ordering data.
To improve query performance using indexes, see About indexes and Indexing data.
To optimize query performance, TimescaleDB enables you to explicitly control the way your data is physically organized in the columnstore. By structuring data effectively, queries can minimize disk reads and execute more efficiently, using vectorized execution for parallel batch processing where possible.
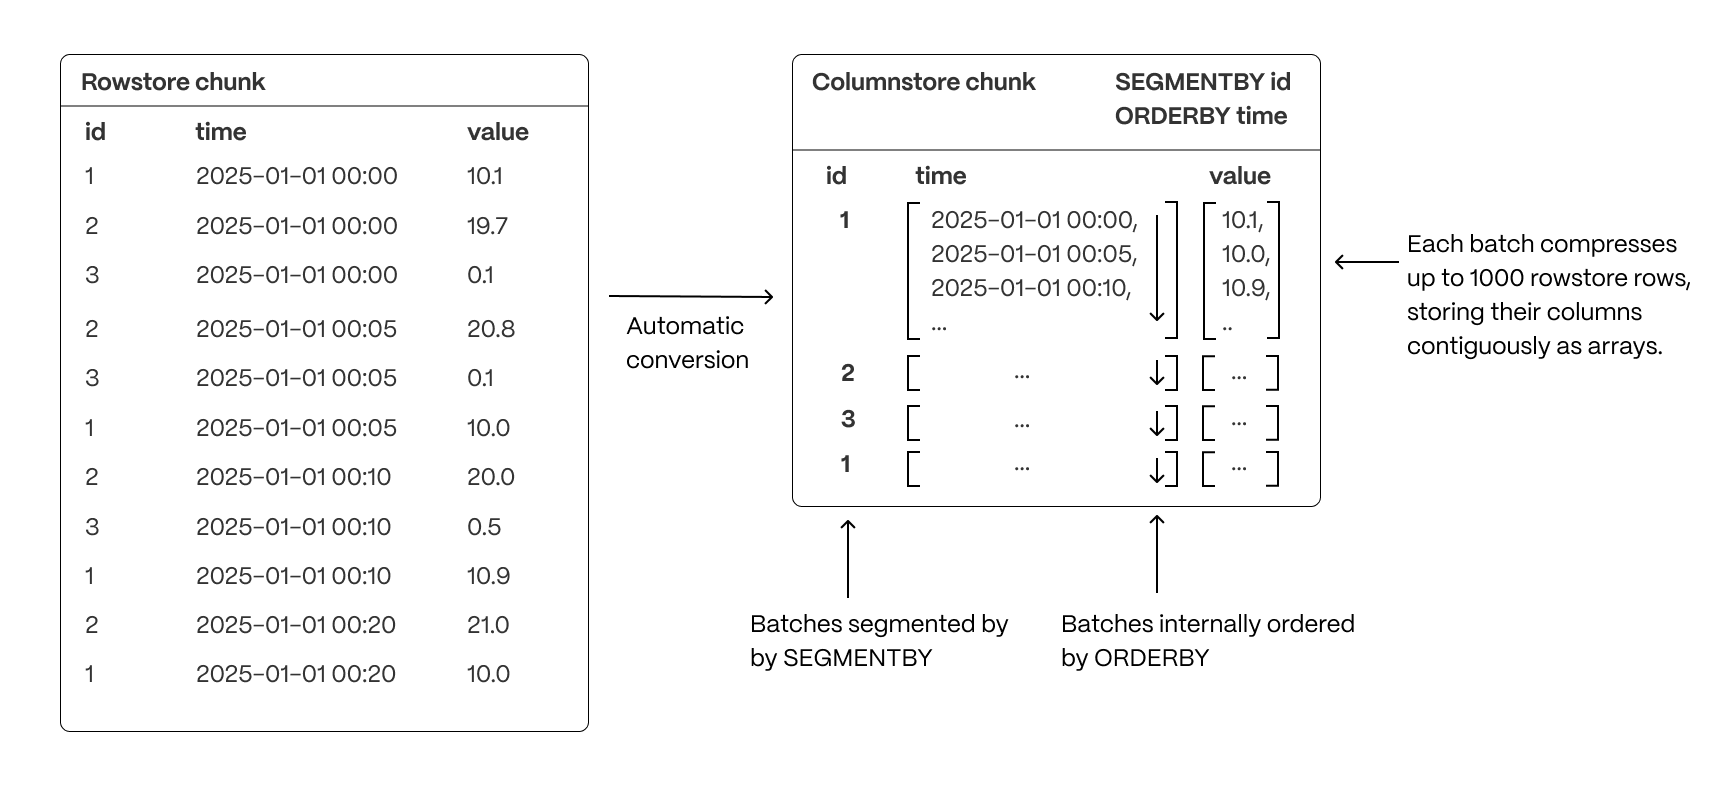
- Group related data together to improve scan efficiency: organizing rows into logical segments ensures that queries filtering by a specific value only scan relevant data sections. For example, in the above, querying for a specific ID is particularly fast.
- Sort data within segments to accelerate range queries: defining a consistent order reduces the need for post-query sorting, making time-based queries and range scans more efficient.
- Reduce disk reads and maximize vectorized execution: a well-structured storage layout enables efficient batch processing (Single Instruction, Multiple Data, or SIMD vectorization) and parallel execution, optimizing query performance.
By combining segmentation and ordering, TimescaleDB ensures that columnar queries are not only fast but also resource-efficient, enabling high-performance real-time analytics.
Ordering data in the columnstore has a large impact on the compression ratio and performance of your queries. Rows that change over a dimension should be close to each other. As hypertables contain time-series data, they are partitioned by time. This makes the time column a perfect candidate for ordering your data since the measurements evolve as time goes on.
If you use orderby as your only columnstore setting, you get a good enough compression ratio to save a lot of
storage and your queries are faster. However, if you only use orderby, you always have to access your data using the
time dimension, then filter the rows returned on other criteria.
Accessing the data effectively depends on your use case and your queries. You segment data in the columnstore to match the way you want to access it. That is, in a way that makes it easier for your queries to fetch the right data at the right time. When you segment your data to access specific columns, your queries are optimized and yield even better performance.
For example, to access information about a single device with a specific device_id, you segment on the device_id column.
This enables you to run analytical queries on compressed data in the columnstore much faster.
For example for the following hypertable:
CREATE TABLE metrics (time TIMESTAMPTZ,user_id INT,device_id INT,data JSONB) WITH (tsdb.hypertable,tsdb.partition_column='time');
Execute a query on a regular hypertable
- Query your dataGives the following result:SELECT device_id, AVG(cpu) AS avg_cpu, AVG(disk_io) AS avg_disk_ioFROM metricsWHERE device_id = 5GROUP BY device_id;device_id | avg_cpu | avg_disk_io-----------+--------------------+---------------------5 | 0.4972598866221261 | 0.49820356730280524(1 row)Time: 177,399 ms
- Query your data
Execute a query on the same data segmented and ordered in the columnstore
Control the way your data is ordered in the columnstore:
ALTER TABLE metrics SET (timescaledb.enable_columnstore = true,timescaledb.orderby = 'time',timescaledb.segmentby = 'device_id');Query your data
select avg(cpu) from metrics where time >= '2024-03-01 00:00:00+01' and time < '2024-03-02 00:00:00+01';Gives the following result:
device_id | avg_cpu | avg_disk_io-----------+-------------------+---------------------5 | 0.497259886622126 | 0.49820356730280535(1 row)Time: 42,139 ms
As you see, using
orderbyandsegmentbynot only reduces the amount of space taken by your data, but also vastly improves query speed.
The number of rows that are compressed together in a single batch (like the ones we see above) is 1000. If your chunk does not contain enough data to create big enough batches, your compression ratio will be reduced. This needs to be taken into account when you define your columnstore settings.
Keywords
Found an issue on this page?Report an issue![]() or Edit this page
or Edit this page![]() in GitHub.
in GitHub.